I’ve gotten rid of most of my social media channels(I just don’t enjoy it anymore), so I’ve been spending more time on Reddit. One subreddit I spend a good amount of time on is the DataIsBeautiful subreddit. I’ve been getting back to my data roots lately and so I decided to post a low-effort visualization I made on the subreddit. AND IT WENT VIRAL.
The graph below got 9,400 upvotes, over 4.5 Million impressions, over 2,800 comments, and was shared over 3,600 times. The post reached the top 25 of r/Popular, which I assume is a big deal because as soon as it made it there I was invited into a private subreddit for popular people(who knew?). The funniest part of all of this is that it’s actually really bad data analysis, which several response posts on r/DataIsBeautiful pointed out like here, here, and here.
So all of this made for an interesting Thursday.
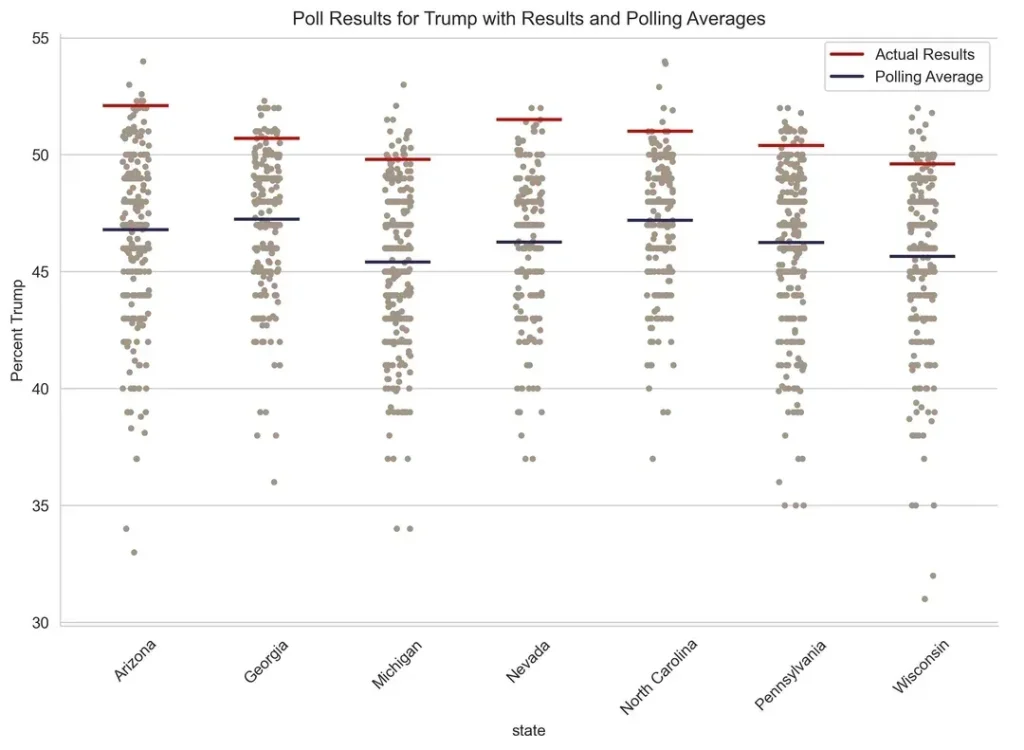
So what did I take away? Going viral is super fun. It was a huge dopamine hit. I haven’t felt this cool in a long time. I even started to make plans to make more data visualizations for all of my adoring fans. Until I took a chill pill and realized I mostly just got lucky and wrote a good headline. Nonetheless, I had lovely delusion of grandeur that I rode for several hours.
For the most part people were nice. I had an interesting exchange with an actual pollster, or at least that’s what he claimed. And I learned a lot about correlated error in election polling. The people who realized this was bad data analysis were mean, which is to be expected. And the people who made response posts were salty, especially because their posts weren’t nearly as popular as mine.
My favorite was the guy who wrote this response post. He did a great job cleaning the data. And guess what? He reached the exact same conclusion as my post. It’s hard to dunk on someone when the data doesn’t go your way.
Overall, going viral on Reddit was a good experience. I was worried I’d get overwhelmed or would get threats because it was a political post. I was also worried that the negative comments would put me in a bad mood. But none of that happened. It was fun and I would gladly go viral again.
Correcting the analysis
I never intended for this graph to take off or be influential. I was just exploring some data while watching TV. I thought it would get a handful of upvotes and disappear into the internet. Had I known it would go viral, I would have been more thorough. So I want to include a list of things I would do to improve the post.
- I would account for time. The data set contains polls that are several years old. There is something to be said that almost no poll in the last few years had Trump doing as well as he did. However, that’s not really the implication of the post. Weighting the polls for time or just removing polls that were older than 90 days would have been better.
- Find a way to account for undecided voters. This is a tricky one that I don’t have an answer to, but is a good critique. If a poll has Trump at 48%, Kamala at 48%, and undecideds at 4%, and he win’s 51% and Kamala wins 49% then technically polls fail to capture both of their actual results. And under estimated both. We go from a poll with three options to a vote with only two options. That undecided segment has to go somewhere. Not sure how you correct for that. Part of me wonders why we even allow undecided to be an option. Nonetheless, it is an issue with the visualization.
- Margin of error. Every poll has a margin of error of 1-3%, which is crazy when you think about it. I did not address that in anyway. Not really sure how I could do that. But this is something I think the polling industry sucks at too. They do a little fuzzy outline of possible outcomes, but everyone ignores them. So while this is an area to improve the analysis, I’m not taking the blame for it.
I learned a good deal about polling from this post. Like did you know there’s a thing called herding? Herding is when pollsters change their results so that they don’t stick out from the crowd. So credit to Ann Selzer for having some guts and looking like an idiot. So this means that polls can start to gather around points that are not reflective of their data and the election. It’s straight cowardice. But it’s also good business. If you go out on a limb and get it wrong, you’re likely out of business as a pollster. And given polling has a random element to it. You could get it wrong even though you did everything right. Tough.
Final note. I think polling is helpful to understand if something will be a blowout. But in a close race, I question the usefulness metus lobortis morbi cras magna vivamus per risus fermentum. Dapibus imperdiet praesent magnis ridiculus congue gravida curabitur sagittis enim magna inceptos sodales parturient.